Market Outlook
November 08, 2017
Market Cues
Domestic Indices
Chg (%)
(Pts)
(Close)
Indian markets are likely to open flat tracking global indices and SGX Nifty.
BSE Sensex
(1.1)
(360)
33,371
Nifty
(1.0)
(102)
10,350
Dow industrials eked out a small gain on Tuesday to end in record territory, but the
broader market was weighed down by a selloff in financials, consumer discretionary
Mid Cap
(1.5)
(246)
16,543
and small-cap stocks amid concerns over the timing and ultimate shape of tax
Small Cap
(1.4)
(243)
17,668
legislation working its way through Congress. The Dow Jones Industrial Average
Bankex
(1.3)
(366)
28,631
ended with a gain of less than 0.1%, at 23,557. The S&P 500 index closed less than
a point lower at 2,591, retreating from an intraday record set earlier in the session.
Global Indices
Chg (%)
(Pts)
(Close)
Meanwhile, the Nasdaq Composite Index declined 0.3%, to 6,768.
Dow Jones
0.0
9
23,557
In UK, FTSE 100 ended the day lower, having started it positively, as European
Nasdaq
(0.3)
(19)
6,768
indices lagged and Wall Street was lower. The UK blue chip index closed down 49
FTSE
(0.7)
(49)
7,513
points at 7,513.
Nikkei
1.7
389
22,938
In India, the benchmark BSE Sensex plunged nearly 400 points intraday on Tuesday
Hang Seng
1.4
398
28,994
due to negative domestic and global cues. Profit-booking by funds and retail
Shanghai Com
0.7
25
3,414
investors, rising crude oil prices, heavy fall in pharma stocks led by Lupin, and DII
selling aided the downtrend. The 30-share BSE index Sensex was down 1.1 per cent
Advances / Declines
BSE
NSE
at 33,371 and the 50-share NSE index Nifty was down 1 per cent at 10,350.
Advances
857
452
Among BSE sectoral indices, healthcare index fell the most by 3.51 per cent
following warning letter issued to Lupin's Goa and Indore sites by USFDA.
Declines
1,921
1,288
Unchanged
117
61
News Analysis
Result Review: Cipla (CMP: `481 / TP: `458 /Downside: 27.4%)
Volumes (` Cr)
Lupin Gets Warning letters for Goa & Indore plant
BSE
5,239
Detailed analysis on Pg2
NSE
40,444
Investor’s Ready Reckoner
Net Inflows (` Cr)
Net
Mtd
Ytd
Key Domestic & Global Indicators
FII
448
3,028
41,480
Stock Watch: Latest investment recommendations on 150+ stocks
MFs
(138)
(138)
95,272
Refer Pg5 onwards
Top Gainers
Price (`)
Chg (%)
Top Picks
CMP
Target
Upside
Company
Sector
Rating
Mmtc
96
10.2
(`)
(`)
(%)
Nbcc
286
8.4
Blue Star
Capital Goods
Buy
675
867
28.4
Dewan Housing Finance
Financials
Accumulate
632
712
12.6
Hexaware
336
4.8
Asian Granito
Other
Buy
483
570
18.0
Naukri
1,230
4.6
Navkar Corporation
Other
Buy
190
265
39.1
Ipcalab
547
4.1
KEI Industries
Capital Goods Accumulate
339
380
12.0
More Top Picks on Pg4
Top Losers
Price (`)
Chg (%)
Key Upcoming Events
Lupin
861
(16.8)
Previous
Consensus
Date
Region
Event Description
Reading
Expectations
Justdial
437
(8.7)
Nov08
China
Exports YoY%
8.10
7.10
Cipla
608
(7.2)
Nov09
US
Initial Jobless claims
229.00
230.50
Bfutilitie
447
(6.9)
Nov09
UK
Industrial Production (YoY)
1.60
1.90
Pcjeweller
351
(6.5)
Nov10
China
Consumer Price Index (YoY)
1.60
1.80
As on November, 07 2017
Nov10
India
Industrial Production YoY
4.30
3.60
Market Outlook
November 08, 2017
News Analysis
Cipla (CMP: `481 / TP: `458 /Downside: 27.4%)
The company posted lower than expected on all fronts. In rupee terms, revenues
came in at `3,988r V/s `4,243cr expectations, up 8.6% yoy. The growth was
mainly driven by domestic sales which posted a growth of 10.2% yoy; while
exports grew by 7.5% yoy. On the operating front the EBITDA margin, came in at
17.8% V/s 19.7% expected, and 16.4% in 2QFY2017; a yoy expansion of
1.4%bps. Consequently, PAT came in at `435cr V/s `499cr expected, a growth of
22.7% yoy. We maintain our sell rating on the stock.
Y/E
Sales OPM
PAT
EPS ROE P/E P/BV EV/EBITDA EV/Sales
March
(` cr)
(%)
(` cr)
(`)
(%)
(x)
(x)
(x)
(x)
FY2018E
30,545
15.0
3,062
35.2
16.8
13.7
2.3
9.9
1.5
FY2019E
32,988
15.0
3,272
37.6
16.2
12.8
2.1
9.1
1.4
Lupin Gets Warning letters for Goa & Indore plant
Lupin, has received a warning letter by the USFDA pertaining to its two
manufacturing facilities located in Goa and Indore (Pithampur Unit II). The
company received 3 form 483 observations in Goa on April 7’2017 and 6 Form
483 observations in Pithampur (unit II) on May 19’2017. As this is a warning letter,
there will be no disruption of existing product supplies from either of these
locations, though there will likely to be a delay of new product approvals from
these two facilities. Both the plants together contribute more than half of the drug
maker’s U.S. sales and approximately 20% of its total sales. Thus any long term
severe outcome; which would lead to impact on future earnings and shareholder
value of the company. At current price of `861, the stock trades at 16.3xFY2018E,
which leaves room for the appreciation in the stock, and thus today’s fall can be
used to buy into the stock. We currently maintain our Buy with a price target of
`1300(though price might be revised after the result update release).
Along with Lupin, other pharma companies, have taken a beating on the stock
markets, which we believe is unwarranted, as these event risks are now common in
the Industry. The only safeguard that investors have is to buy the stock for the value
it offers at the profitability the company offers. Like in the case of Lupin, even if the
earnings of the company would be impacted in FY2019E, the stock will still offer
20% return from CMP, given low valuations. Thus we recommend, that investors to
make stock specific decision based on valuations and not news.
Economic and Political News
Congress to seek overhaul of GST at next Council meet
I-T cracks whip on benami lands, seizes 541 assets
DeMo effect: Cash-surplus banks cut costly deposits
Corporate News
ONGC, Oil India gain up to 3% as oil prices rule at highest since 2015
Reliance Communications skips bond interest payment
Tata Steel sets up largest CDQ facility at Kalinganagar
Market Outlook
November 08, 2017
Quarterly Bloomberg Brokers Consensus Estimate
UBL Ltd - Nov 08, 2017
Particulars ( ` cr)
2QFY18E
2QFY17
y-o-y (%)
1QFY18
q-o-q (%)
Sales
1,119
1,038
7.9
1,674
(33.2)
EBIDTA
125
121
3.4
318
(60.9)
%
11.2
11.7
19.1
PAT
31
27
14.8
162
(80.8)
Ashok Leyland Ltd - Nov 08, 2017
Particulars ( ` cr)
2QFY18E
2QFY17
y-o-y (%)
1QFY18
q-o-q (%)
Sales
6,177
4,622
33.7
4,237
45.8
EBIDTA
680
536
26.9
290
134
%
11.1
11.6
6.9
PAT
383
294
30.3
111
245
Bharat Forge Ltd - Nov 08, 2017
Particulars ( ` cr)
2QFY18E
2QFY17
y-o-y (%)
1QFY18
q-o-q (%)
Sales
1,248
890
40.2
1,200
4.1
EBIDTA
358
247
44.9
333
7.5
%
28.7
27.8
27.8
PAT
198
126
57.1
175
13.1
Pidilite Industries Ltd - Nov 08, 2017
Particulars ( ` cr)
2QFY18E
2QFY17
y-o-y (%)
1QFY18
q-o-q (%)
Sales
1,492
1,417
5.3
1,528
(2.3)
EBIDTA
331
321
3.1
320
3.4
%
22.2
22.6
20.9
PAT
232
230
0.9
226
2.6
Petronet Ltd - Nov 08, 2017
Particulars ( ` cr)
2QFY18E
2QFY17
y-o-y (%)
1QFY18
q-o-q (%)
Sales
6,906
6,614
4.4
6,435
7.3
EBIDTA
764
726
5.2
744
2.7
%
11.1
10.9
11.5
PAT
465
459
1.3
437
6.4
Shree Cements Ltd - Nov 08, 2017
Particulars ( ` cr)
2QFY18E
2QFY17
y-o-y (%)
1QFY18
q-o-q (%)
Sales
2,154
2,006
7.4
2,536
(15.1)
EBIDTA
487
656
(25.7)
679
(28.3)
%
22.6
32.7
26.8
PAT
277
291
(4.8)
440
(37.1)
Market Outlook
November 08, 2017
Top Picks HHHHH
Market Cap
CMP
Target
Upside
Company
Rationale
(` Cr)
(`)
(`)
(%)
Strong growth in domestic business due to its leade`hip
in acute therapeutic segment. Alkem expects to launch
Alkem Laboratories
23,204
1,941
2,125
9.5
more products in USA, which bodes for its international
business.
We expect the company would report strong profitability
Asian Granito
1,453
483
570
18.0
owing to better product mix, higher B2C sales and
amalgamation synergy.
Favorable outlook for the AC industry to augur well for
Cooling products business which is out pacing the
Blue Star
6,464
675
867
28.4
market growth. EMPPAC division's profitability to
improve once operating environment turns around.
With a focus on the low and medium income (LMI)
consumer segment, the company has increased its
Dewan Housing Finance
19,826
632
712
12.6
presence in tier-II & III cities where the growth
opportunity is immense.
Loan growth is likely to pick up after a sluggish FY17.
Lower credit cost will help in strong bottom-line growth.
Karur Vysya Bank
7,560
125
180
43.9
Increasing share of CASA will help in NIM
improvement.
High order book execution in EPC segment, rising B2C
KEI Industries
2,639
339
380
12.0
sales and higher exports to boost the revenues and
profitability
Expected to benefit from the lower capex requirement
Music Broadcast
2,177
382
434
13.7
and 15 year long radio broadcast licensing.
Massive capacity expansion along with rail advantage
Navkar Corporation
2,716
190
265
39.1
at ICD as well CFS augur well for the company
Strong brands and distribution network would boost
Siyaram Silk Mills
2,790
595
650
9.2
growth going ahead. Stock currently trades at an
inexpensive valuation.
Market leadership in Hindi news genre and no.
2
viewership ranking in English news genre, exit from the
TV Today Network
2,142
359
435
21.1
radio business, and anticipated growth in ad spends by
corporate to benefit the stock.
After GST, the company is expected to see higher
volumes along with improving product mix. The Gujarat
Maruti Suzuki
2,48,771
8,235
8,890
8.0
plant will also enable higher operating leverage which
will be margin accretive.
We expect loan book to grow at 24.3% over next two
GIC Housing
2,520
468
655
40.0
year; change in borrowing mix will help in NIM
improvement..
Source: Company, Angel Research
Market Outlook
November 08, 2017
Key Upcoming Events
Result Calendar
Date
Company
November 08, 2017
Bharat Forge, Ashok Leyland, Thermax, J K Lakshmi Cements, Oriental Bank, Electrosteel Castings, Petronet LNG, ITD
November 10, 2017
M&M, Bosch India, Motherson Sumi, Suzlon Energy, St Bk of India, Bank of India, Allahabad Bank, MRF, HSIL, DLF
Source: Bloomberg, Angel Research
Global economic events release calendar
Bloomberg Data
Date
Time
Country
Event Description
Unit
Period
Last Reported
Estimated
Nov 08, 2017
China
Exports YoY%
% Change
Oct
8.10
7.20
Nov 09, 2017
7:00 AMChina
Consumer Price Index (YoY)
% Change
Oct
1.60
1.70
7:00 PMUS
Initial Jobless claims
Thousands
Nov 4
229.00
231.50
Nov 10, 2017
3:00 PMUK
Industrial Production (YoY)
% Change
Sep
1.60
1.90
India
Exports YoY%
% Change
Oct
25.67
Nov 13, 2017
5:30 PMIndia
Industrial Production YoY
% Change
Sep
4.30
3.60
India
Imports YoY%
% Change
Oct
18.09
Nov 14, 2017
3:30 PMEuro Zone Euro-Zone GDP s.a. (QoQ)
% Change
3Q P
0.60
7:30 AMChina
Industrial Production (YoY)
% Change
Oct
6.60
6.30
3:00 PMUK
CPI (YoY)
% Change
Oct
3.00
12:00 PMIndia
Monthly Wholesale Prices YoY%
% Change
Oct
2.60
US
Producer Price Index (mom)
% Change
Oct
0.80
12:30 PMGermany GDP nsa (YoY)
% Change
3Q P
0.80
Nov 15, 2017
3:00 PMUK
Jobless claims change
% Change
Oct
1.70
7:00 PMUS
Consumer price index (mom)
% Change
Oct
0.50
0.10
Source: Bloomberg, Angel Research
Market Outlook
November 08, 2017
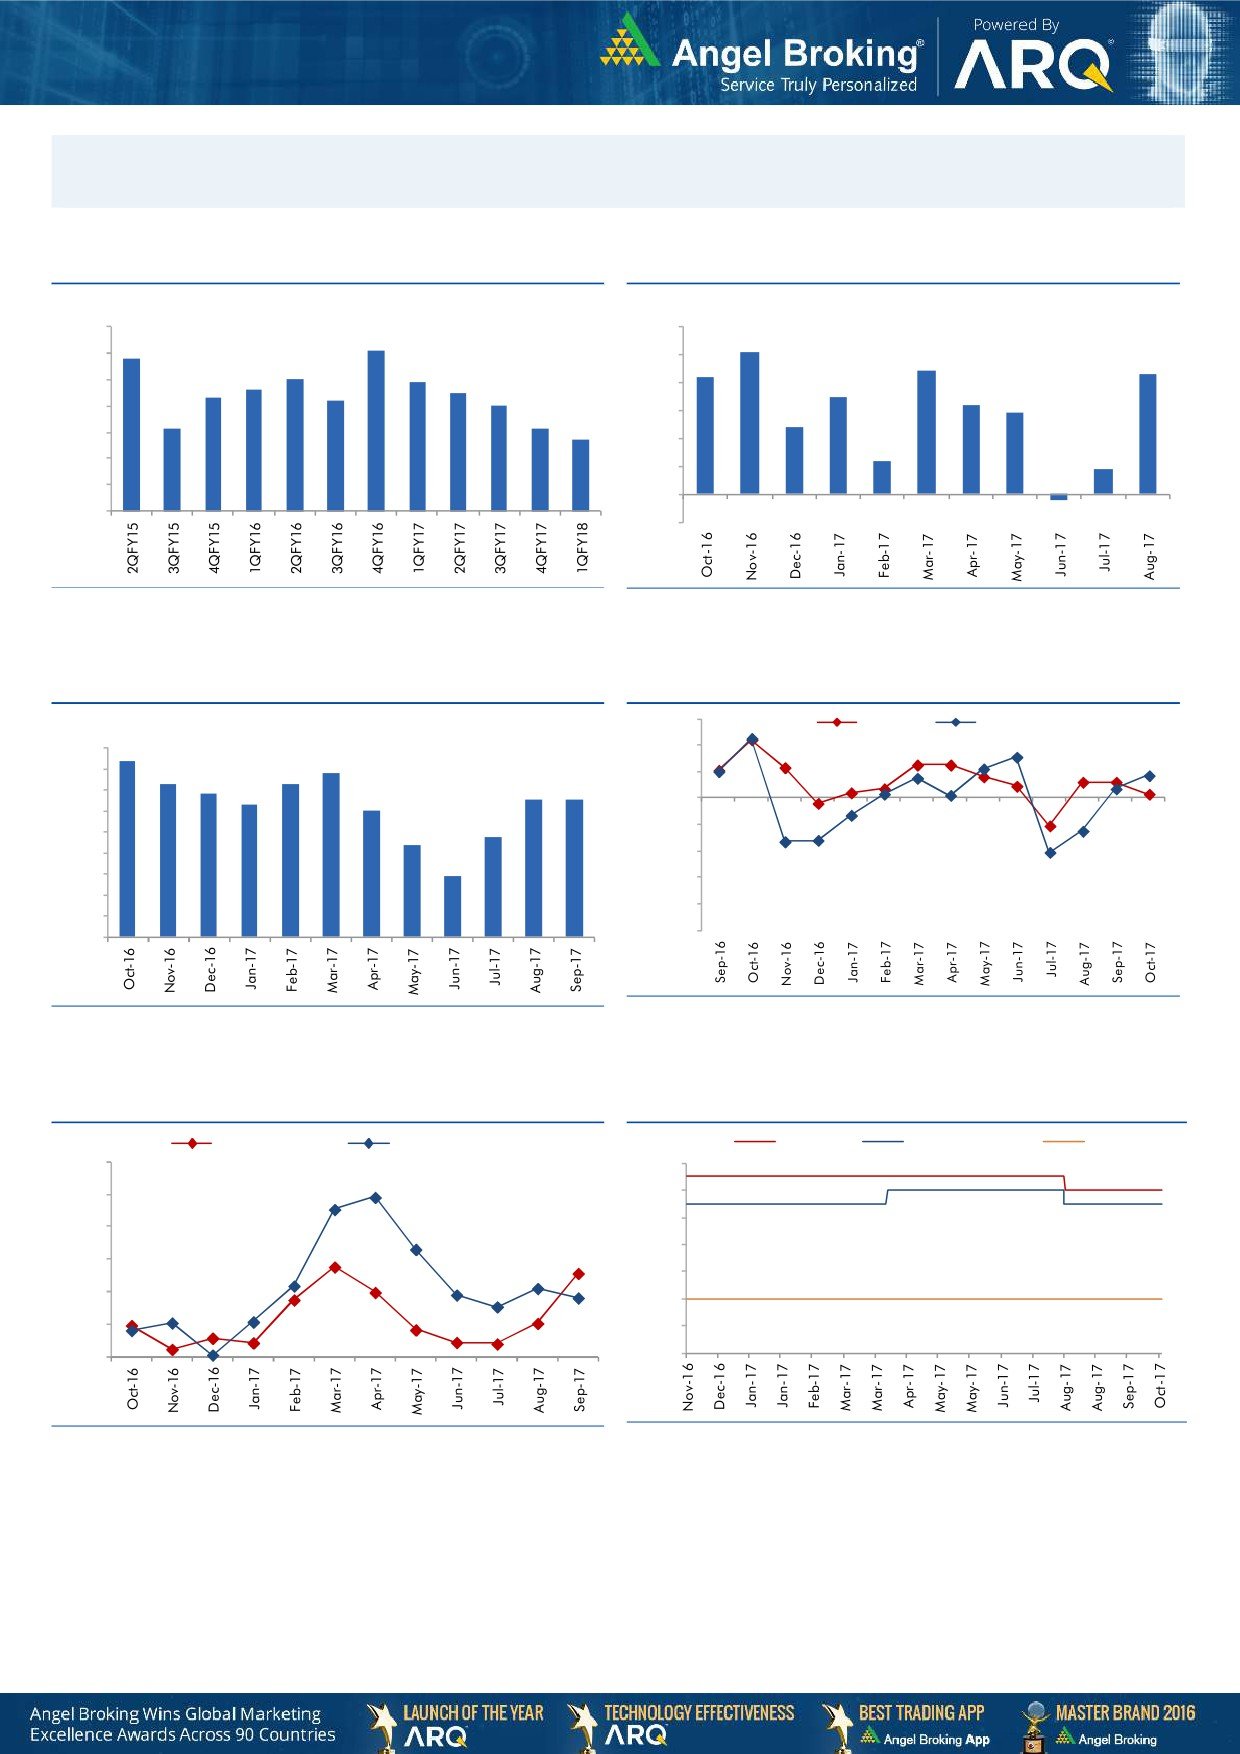
Macro watch
Exhibit 1: Quarterly GDP trends
Exhibit 2: IIP trends
(%)
(%)
10.0
6.0
9.1
5.1
8.8
9.0
5.0
4.4
4.3
8.0
7.9
4.2
7.6
7.5
8.0
7.3
7.2
4.0
3.5
7.0
3.2
2.9
7.0
6.1
6.1
3.0
2.4
5.7
6.0
2.0
1.2
0.9
5.0
1.0
4.0
-
3.0
(1.0)
(0.2)
Source: CSO, Angel Research
Source: MOSPI, Angel Research
Exhibit 3: Monthly CPI inflation trends
Exhibit 4: Manufacturing and services PMI
56.0
Mfg. PMI
Services PMI
(%)
4.5
4.2
54.0
3.9
4.0
3.6
3.7
52.0
3.4
3.3
3.3
3.5
3.2
3.0
50.0
3.0
2.2
2.4
48.0
2.5
2.0
46.0
1.5
1.5
44.0
1.0
42.0
0.5
40.0
-
Source: Market, Angel Research; Note: Level above 50 indicates expansion
Source: MOSPI, Angel Research
Exhibit 5: Exports and imports growth trends
Exhibit 6: Key policy rates
(%)
Exports yoy growth
Imports yoy growth
(%)
Repo rate
Reverse Repo rate
CRR
60.0
6.50
50.0
6.00
5.50
40.0
5.00
30.0
4.50
20.0
4.00
10.0
3.50
0.0
3.00
Source: Bloomberg, Angel Research
Source: RBI, Angel Research
Market Outlook
November 08, 2017
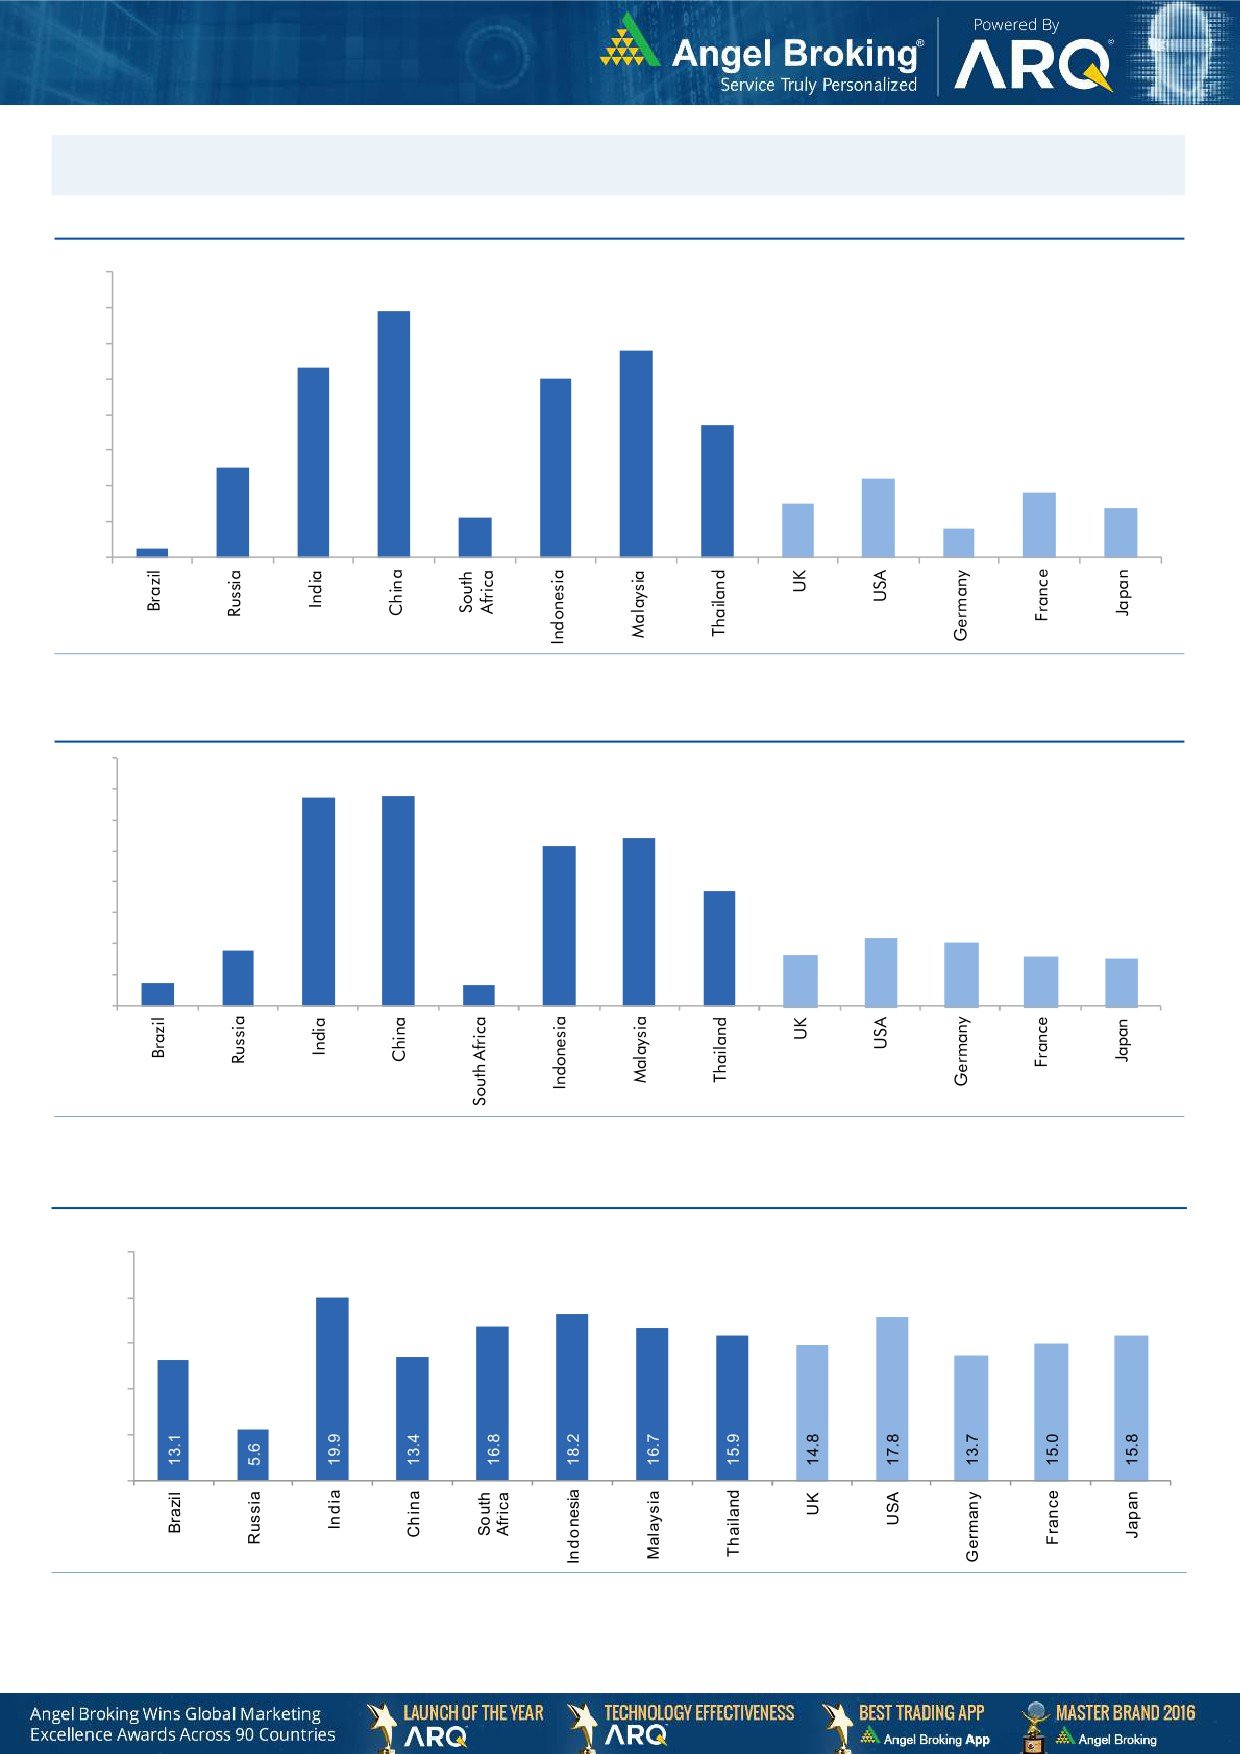
Global watch
Exhibit 1: Latest quarterly GDP Growth (%, yoy) across select developing and developed countries
(%)
8.0
6.9
7.0
5.8
6.0
5.3
5.0
5.0
1.1
3.7
4.0
2.5
3.0
2.2
1.8
2.0
1.5
1.4
0.8
1.0
0.3
-
Source: Bloomberg, Angel Research
Exhibit 2: 2017 GDP Growth projection by IMF (%, yoy) across select developing and developed countries
(%)
6.7
6.8
7.0
6.0
5.4
5.2
5.0
3.7
4.0
3.0
1.8
2.2
2.0
1.7
1.6
2.0
0.7
1.5
0.7
1.0
-
Source: IMF, Angel Research
Exhibit 3: One year forward P-E ratio across select developing and developed countries
(x)
25.0
20.0
15.0
10.0
5.0
-
Source: IMF, Angel Research
Market Outlook
November 08, 2017
Exhibit 4: Relative performance of indices across globe
Returns (%)
Country
Name of index
Closing price
1M
3M
1YR
Brazil
Bovespa
72,415
(3.2)
11.3
17.3
Russia
Micex
2,156
1.9
6.9
5.8
India
Nifty
10,350
4.7
3.4
22.0
China
Shanghai Composite
3,414
1.9
3.9
10.0
South Africa
Top 40
53,833
5.8
8.5
23.5
Mexico
Mexbol
49,005
(3.2)
(4.7)
1.0
Indonesia
LQ45
1,010
2.6
5.3
8.6
Malaysia
KLCI
1,751
(0.5)
(1.1)
4.8
Thailand
SET 50
1,088
0.6
8.5
15.9
USA
Dow Jones
23,557
3.4
6.5
29.0
UK
FTSE
7,513
(0.1)
(0.4)
8.7
Japan
Nikkei
22,938
11.2
14.5
31.6
Germany
DAX
13,379
4.0
10.0
26.8
France
CAC
5,481
2.6
6.9
21.3
Source: Bloomberg, Angel Research p68in4
Stock Watch
November 08, 2017
Company Name
Reco
CMP
Target
Mkt Cap
Sales ( Čcr )
OPM(%)
EPS (Č)
PER(x)
P/BV(x)
RoE(%)
EV/Sales(x)
(Č)
Price ( Č)
( Č cr )
FY18E FY19E
FY18E
FY19E
FY18E
FY19E
FY18E
FY19E
FY18E
FY19E
FY18E
FY19E
FY18E
FY19E
Agri / Agri Chemical
Rallis
Reduce
237
209
4,602
1,873
2,099
15.0
15.0
9.5
10.5
24.9
22.5
3.8
3.4
15.8
16.0
2.4
2.1
United Phosphorus
Accumulate
741
820
37,656
18,922
21,949
18.0
18.5
36.2
45.6
20.5
16.3
4.3
3.5
22.7
23.8
2.2
1.8
Auto & Auto Ancillary
Ashok Leyland
Neutral
122
-
35,704
23,339
27,240
10.1
10.8
4.7
6.2
26.2
19.6
5.2
4.6
20.0
23.6
1.5
1.3
Bajaj Auto
Neutral
3,163
-
91,534
23,936
27,955
19.5
20.1
142.7
167.3
22.2
18.9
4.8
4.3
21.8
22.8
3.4
2.9
Bharat Forge
Buy
715
875
33,304
7,637
8,755
21.7
23.2
36.1
47.3
19.8
15.1
3.6
3.0
18.5
20.8
4.2
3.6
Eicher Motors
Neutral
31,160
-
84,825
19,043
22,837
19.5
19.9
835.4
1,019.0
37.3
30.6
13.9
10.7
40.9
37.8
4.3
3.6
Gabriel India
Neutral
198
-
2,837
1,782
2,033
9.7
10.2
7.1
8.9
27.8
22.3
5.6
4.8
21.0
22.2
1.5
1.3
Hero Motocorp
Accumulate
3,682
4,129
73,522
32,239
36,878
16.0
15.6
184.4
206.5
20.0
17.8
6.3
5.5
31.3
30.7
2.1
1.8
Jamna Auto Industries Neutral
64
-
2,532
1,441
1,662
14.4
14.8
13.9
17.6
4.6
3.6
1.3
1.0
30.0
31.0
1.8
1.5
Mahindra and Mahindra Neutral
1,355
-
84,130
46,971
53,816
13.6
14.0
67.7
79.8
20.0
17.0
2.9
2.6
15.0
15.9
1.7
1.4
Maruti
Accumulate
8,235
8,890
248,771
80,985
97,917
15.6
16.9
282.3
370.4
29.2
22.2
6.4
5.1
21.8
23.1
2.7
2.2
Minda Industries
Neutral
966
-
8,349
4,328
5,084
11.0
11.9
27.3
36.4
35.5
26.5
7.5
5.9
23.1
25.6
2.0
1.7
Motherson Sumi
Neutral
367
-
77,291
55,937
64,445
10.8
11.4
16.9
21.1
21.7
17.4
4.9
5.0
25.2
25.4
1.4
1.2
Tata Motors
Neutral
452
-
130,479
303,167
343,649
11.8
13.8
33.1
54.7
13.7
8.3
2.2
1.8
16.9
23.0
0.5
0.4
TVS Motor
Neutral
708
-
33,629
13,992
16,216
9.0
9.4
17.1
20.3
41.5
34.9
11.0
8.5
29.7
27.7
2.3
2.0
Amara Raja Batteries
Buy
681
858
11,632
6,140
7,122
14.3
15.6
29.3
39.0
23.2
17.5
4.0
3.3
17.1
19.0
1.9
1.6
Exide Industries
Neutral
201
-
17,085
8,689
9,854
15.1
15.2
9.7
11.0
20.8
18.3
3.7
3.3
15.7
16.1
1.7
1.5
Apollo Tyres
Neutral
234
-
11,919
15,739
17,326
13.3
14.6
20.4
26.7
11.5
8.8
1.4
1.2
20.4
26.7
1.0
0.9
Ceat
Neutral
1,716
-
6,942
6,661
7,717
11.1
14.2
116.2
178.2
14.8
9.6
2.6
2.1
15.2
21.3
1.2
1.0
JK Tyres
Neutral
148
-
3,348
8,318
9,239
16.2
16.4
21.0
27.5
7.1
5.4
1.4
1.1
19.1
20.4
0.9
0.7
Swaraj Engines
Neutral
1,950
-
2,422
788
889
16.4
16.5
71.6
81.0
27.2
24.1
7.9
7.3
29.6
31.0
2.7
2.4
Subros
Neutral
252
-
1,510
1,855
2,135
11.6
11.8
10.3
14.7
24.6
17.2
3.7
3.2
15.8
19.1
1.0
0.9
Capital Goods
BEML
Neutral
1,748
-
7,279
4,286
5,194
7.1
8.2
42.9
58.1
40.7
30.1
3.3
3.0
7.6
8.7
1.8
1.4
Bharat Electronics
Neutral
180
-
44,275
10,258
12,470
19.6
19.5
7.3
8.6
24.7
21.0
0.5
0.4
20.4
21.9
3.8
3.1
Voltas
Neutral
549
-
18,171
6,778
8,004
9.6
11.0
17.1
22.4
32.1
24.5
7.7
6.7
17.7
19.8
2.4
2.0
BHEL
Neutral
93
-
34,199
33,200
39,167
6.8
9.5
6.2
11.2
15.0
8.3
0.7
0.7
4.6
8.0
0.6
0.5
Blue Star
Buy
675
867
6,464
5,220
6,207
6.3
6.6
16.8
22.3
40.2
30.3
8.0
7.1
19.9
23.3
1.2
1.0
CG Power and Industrial
Neutral
88
-
5,512
6,555
7,292
7.5
7.5
-
0.8
8,795.0
109.9
1.4
1.4
0.1
1.2
0.9
0.8
Solutions
Greaves Cotton
Neutral
127
-
3,094
1,778
1,993
14.7
15.1
8.1
9.1
15.6
13.9
3.5
3.3
21.8
23.6
1.5
1.3
Stock Watch
November 08, 2017
Company Name
Reco
CMP
Target
Mkt Cap
Sales ( Čcr )
OPM(%)
EPS (Č)
PER(x)
P/BV(x)
RoE(%)
EV/Sales(x)
(Č)
Price ( Č)
( Č cr )
FY18E FY19E
FY18E
FY19E
FY18E
FY19E
FY18E
FY19E
FY18E
FY19E
FY18E
FY19E
FY18E
FY19E
Capital Goods
KEC International
Accumulate
310
350
7,965
9,779
11,113
9.4
9.8
14.2
18.2
21.8
17.0
4.2
3.4
21.1
22.1
1.1
0.9
KEI Industries
Accumulate
339
380
2,639
3,001
3,391
10.0
10.0
13.0
16.1
26.1
21.1
4.7
3.9
18.2
18.7
1.1
0.9
Thermax
Neutral
965
-
11,499
4,125
4,747
10.3
10.8
26.7
31.5
36.1
30.6
4.1
3.7
11.2
12.0
2.5
2.2
VATech Wabag
Buy
587
681
3,206
3,867
4,126
9.6
10.0
34.9
39.8
16.8
14.8
2.8
2.4
17.7
17.5
0.8
0.8
Cement
ACC
Neutral
1,785
-
33,515
12,255
13,350
13.5
14.3
58.0
66.2
30.8
27.0
3.6
3.4
11.5
12.2
2.7
2.5
Ambuja Cements
Neutral
276
-
54,853
10,250
11,450
17.5
19.0
7.2
8.3
38.4
33.3
2.8
2.6
7.0
7.8
5.1
4.5
India Cements
Neutral
175
-
5,382
6,135
6,750
14.8
15.2
8.5
11.5
20.6
15.2
1.0
1.0
4.8
6.2
1.2
1.1
JK Cement
Neutral
1,023
-
7,150
4,150
4,775
19.2
20.0
49.0
63.5
20.9
16.1
3.3
2.8
17.0
18.5
2.2
1.8
J K Lakshmi Cement
Neutral
436
-
5,132
3,422
3,757
15.5
17.0
13.5
23.2
32.3
18.8
3.4
2.9
10.8
15.5
1.9
1.7
Orient Cement
Neutral
173
-
3,552
2,215
3,233
16.8
17.0
5.9
6.9
29.4
25.1
2.3
2.1
10.8
10.1
2.6
1.7
UltraTech Cement
Neutral
4,361
-
119,731
28,250
35,150
20.2
23.5
77.5
122.2
56.3
35.7
4.7
4.3
9.6
14.8
4.7
3.8
Construction
KNR Constructions
Neutral
261
-
3,665
1,846
2,203
14.5
14.5
12.1
13.7
21.5
19.1
1.2
1.0
17.5
16.7
2.0
1.7
Larsen & Toubro
Neutral
1,211
-
169,578
95,787
109,476
10.2
11.6
44.5
50.8
27.2
23.9
3.4
3.1
12.9
13.1
2.3
2.1
Gujarat Pipavav Port
Neutral
137
-
6,601
739
842
61.6
62.7
5.1
6.2
26.8
22.2
3.3
3.3
12.7
14.9
8.4
7.2
PNC Infratech
Neutral
191
-
4,910
2,040
2,935
13.0
13.0
6.4
9.0
29.9
21.3
0.8
0.7
9.7
12.2
2.4
1.7
Simplex Infra
Neutral
524
-
2,593
6,012
6,619
11.6
11.7
21.1
31.0
24.9
16.9
1.7
1.6
6.5
8.6
1.0
0.9
Sadbhav Engineering
Neutral
308
-
5,287
3,823
4,426
10.7
10.8
10.3
11.8
29.9
26.1
3.6
3.1
10.1
10.5
1.7
1.5
NBCC
Neutral
286
-
25,754
9,099
12,706
6.4
6.4
7.3
9.6
39.3
29.9
1.7
1.4
27.5
30.5
2.7
1.9
MEP Infra
Neutral
101
-
1,646
2,403
2,910
18.3
16.8
2.4
6.1
43.1
16.7
16.3
11.0
35.2
55.8
1.8
1.5
SIPL
Neutral
124
-
4,364
2,060
2,390
46.8
47.7
(5.8)
(3.1)
4.6
5.3
(14.2)
(2.3)
6.9
6.4
Engineers India
Neutral
193
-
13,019
1,795
2,611
21.1
22.4
5.9
8.1
32.8
23.9
2.3
2.3
12.9
16.1
5.6
3.7
Financials
Axis Bank
Accumulate
527
580
126,377
32,558
35,843
3.5
3.2
27.8
41.0
19.0
12.9
2.1
1.8
11.4
14.9
-
-
Bank of Baroda
Neutral
165
-
38,007
22,533
26,079
2.4
2.4
12.0
20.9
13.7
7.9
0.9
0.8
6.6
11.0
-
-
Canara Bank
Neutral
391
-
23,354
17,925
20,235
2.0
2.1
18.5
36.5
21.1
10.7
0.8
0.8
3.4
6.2
-
-
Can Fin Homes
Neutral
456
-
6,072
586
741
3.5
3.5
107.8
141.0
4.2
3.2
0.9
0.8
24.1
25.6
-
-
Cholamandalam Inv. &
Neutral
1,269
-
19,829
2,826
3,307
6.3
6.3
53.7
64.6
23.7
19.7
4.0
3.4
18.3
18.9
-
-
Fin. Co.
Dewan Housing Finance Accumulate
633
712
19,843
2,676
3,383
2.4
2.7
37.4
49.7
16.9
12.7
2.2
1.9
13.8
16.2
-
-
Equitas Holdings
Buy
140
235
4,743
1,125
1,380
9.6
9.8
1.5
6.0
93.3
23.3
2.1
2.0
2.4
8.2
-
-
Federal Bank
Accumulate
114
125
22,178
4,896
5,930
2.8
3.1
5.4
7.6
21.2
15.0
1.8
1.7
8.5
11.0
-
-
Stock Watch
November 08, 2017
Company Name
Reco
CMP
Target
Mkt Cap
Sales ( Čcr )
OPM(%)
EPS (Č)
PER(x)
P/BV(x)
RoE(%)
EV/Sales(x)
(Č)
Price ( Č)
( Č cr )
FY18E FY19E
FY18E
FY19E
FY18E
FY19E
FY18E
FY19E
FY18E
FY19E
FY18E
FY19E
FY18E
FY19E
Financials
GIC Housing
Buy
468
655
2,520
376
477
3.6
3.7
33.0
40.0
14.2
11.7
2.5
2.2
20.0
23.0
-
-
HDFC Bank
Neutral
1,824
-
471,334
55,236
63,253
4.5
4.4
68.9
82.4
26.5
22.1
4.6
3.8
18.7
18.5
-
-
ICICI Bank
Neutral
312
-
200,312
42,361
51,378
3.6
3.9
18.4
25.7
17.0
12.1
1.9
1.8
11.3
15.0
-
-
Karur Vysya Bank
Buy
125
180
7,560
3,289
3,630
3.7
3.9
10.8
14.1
11.6
8.9
1.4
1.2
12.5
14.7
-
-
LIC Housing Finance
Neutral
601
-
30,328
4,895
6,332
3.4
3.7
50.7
66.8
11.9
9.0
2.4
2.0
21.7
23.8
-
-
Punjab Natl.Bank
Neutral
191
-
40,591
23,708
25,758
2.1
2.1
5.9
16.4
32.5
11.6
1.0
0.9
3.0
8.3
-
-
RBL Bank
Neutral
515
-
21,283
2,309
2,888
2.6
2.5
16.4
19.1
31.5
27.0
4.0
3.5
13.3
13.8
-
-
Repco Home Finance
Buy
588
825
3,679
496
597
4.4
4.2
38.5
48.7
15.3
12.1
2.7
2.3
19.6
20.6
-
-
South Ind.Bank
Neutral
31
-
5,521
3,195
3,567
3.0
3.1
3.0
3.8
10.1
8.0
1.0
0.9
10.5
11.9
-
-
St Bk of India
Neutral
317
-
273,809
105,827
121,056
2.4
2.5
16.1
25.6
19.7
12.4
1.5
1.4
6.6
9.9
-
-
Union Bank
Neutral
166
-
12,066
14,650
16,225
2.3
2.3
23.1
32.5
7.2
5.1
0.5
0.5
7.1
9.2
-
-
Yes Bank
Neutral
311
-
71,326
11,088
13,138
3.0
2.9
84.0
99.3
3.7
3.1
0.6
0.5
16.3
16.8
-
-
FMCG
Akzo Nobel India
Neutral
1,820
-
8,728
3,164
3,607
13.8
13.7
58.6
67.9
31.1
26.8
7.6
6.7
24.5
25.1
2.6
2.3
Asian Paints
Neutral
1,142
-
109,569
17,603
20,615
18.6
18.6
2,128.9
2,543.3
0.5
0.5
11.3
9.5
28.0
28.9
6.0
5.1
Britannia
Neutral
4,652
-
55,854
9,690
11,278
14.8
15.4
84.0
101.0
55.4
46.1
20.2
16.0
40.6
39.0
5.7
4.9
Colgate
Neutral
1,035
-
28,148
4,420
5,074
24.9
25.3
28.6
32.8
36.2
31.6
14.3
11.5
43.8
40.5
6.1
5.3
Dabur India
Neutral
340
-
59,821
8,346
9,344
19.6
19.9
7.8
9.0
43.5
37.7
8.8
7.9
25.2
24.8
6.8
6.0
GlaxoSmith Con*
Neutral
5,467
-
22,990
5,072
5,760
18.2
18.4
176.3
199.2
31.0
27.4
6.6
6.0
21.2
21.7
3.9
3.3
Godrej Consumer
Neutral
979
-
66,712
10,171
11,682
20.8
21.5
21.7
27.1
45.1
36.1
10.2
8.7
22.3
23.4
6.7
5.8
HUL
Neutral
1,235
-
267,226
37,077
41,508
20.3
21.8
5,189.9
6,318.5
0.2
0.2
37.6
32.2
74.8
82.0
7.1
6.3
ITC
Neutral
266
-
323,570
44,588
49,853
37.0
37.3
9.6
11.0
27.7
24.2
6.8
6.5
25.1
27.3
6.7
6.0
Marico
Neutral
310
-
40,005
6,788
7,766
18.5
19.2
7.1
8.5
43.7
36.5
15.3
13.1
36.9
38.0
5.7
5.0
Nestle*
Neutral
7,695
-
74,192
10,083
11,182
20.0
20.9
119.7
141.3
64.3
54.5
226.6
207.1
36.7
39.8
7.0
6.3
Tata Global
Neutral
225
-
14,200
7,121
7,641
11.9
12.3
6.9
8.0
32.6
28.1
2.2
2.1
6.8
7.2
1.8
1.7
Procter & Gamble
Neutral
8,860
-
28,760
3,034
3,579
27.1
27.7
167.7
198.8
52.8
44.6
14.2
12.2
28.8
29.5
8.9
7.5
Hygiene
IT
HCL Tech^
Buy
876
1,014
125,004
50,009
54,608
22.1
22.1
62.8
67.6
14.0
13.0
3.1
2.7
22.4
20.6
2.2
1.9
Infosys
Buy
956
1,120
219,524
70,333
75,960
26.0
26.0
61.7
65.9
15.5
14.5
2.9
2.7
18.9
18.7
2.5
2.3
TCS
Neutral
2,708
-
533,661
123,384
134,488
26.1
26.1
133.2
143.7
20.3
18.9
5.6
5.2
27.6
27.8
4.0
3.6
Tech Mahindra
Accumulate
471
533
45,955
31,015
33,496
15.0
15.0
35.6
38.1
13.2
12.4
2.3
2.1
17.0
16.3
1.3
1.1
Stock Watch
November 08, 2017
Company Name
Reco
CMP
Target
Mkt Cap
Sales ( Čcr )
OPM(%)
EPS (Č)
PER(x)
P/BV(x)
RoE(%)
EV/Sales(x)
(Č)
Price ( Č)
( Č cr )
FY18E FY19E
FY18E
FY19E
FY18E
FY19E
FY18E
FY19E
FY18E
FY19E
FY18E
FY19E
FY18E
FY19E
IT
Wipro
Neutral
302
-
147,023
54,164
56,544
22.3
22.3
18.8
19.5
16.1
15.5
2.6
2.2
15.0
13.6
1.9
1.7
Media
D B Corp
Neutral
358
-
6,580
2,404
2,625
30.5
31.5
23.7
26.9
15.1
13.3
3.6
3.0
23.5
22.8
2.6
2.3
HT Media
Neutral
100
-
2,338
2,589
2,830
15.1
15.4
8.3
10.9
12.1
9.2
1.0
0.9
8.4
10.4
0.4
0.3
Jagran Prakashan
Buy
174
225
5,690
2,541
2,835
28.5
28.7
12.7
14.1
13.7
12.3
2.8
2.5
21.3
21.4
2.1
1.8
Sun TV Network
Neutral
875
-
34,478
3,238
3,789
51.9
55.1
30.9
38.0
28.3
23.0
8.1
7.1
30.0
31.0
10.2
8.6
Hindustan Media
Neutral
242
-
1,776
1,002
1,074
23.3
23.5
29.2
33.8
8.3
7.2
1.3
1.1
15.6
15.4
0.8
0.5
Ventures
TV Today Network
Buy
359
435
2,142
667
727
27.7
27.7
18.6
20.1
19.3
17.9
3.0
3.1
15.6
17.3
2.7
2.6
Music Broadcast Limited Accumulate
382
434
2,178
271
317
91.0
109.0
6.0
10.0
63.6
38.2
4.0
3.6
6.5
9.3
7.6
6.3
Metals & Mining
Coal India
Neutral
285
-
176,756
82,301
91,235
17.0
18.0
17.1
20.5
16.7
13.9
3.1
2.9
45.0
55.0
1.8
1.6
Hind. Zinc
Neutral
318
-
134,365
22,108
24,555
57.0
58.0
22.1
26.3
14.4
12.1
4.7
3.8
32.0
35.0
5.1
4.3
Hindalco
Neutral
267
-
59,949
102,350
105,355
13.5
14.5
21.5
24.5
12.4
10.9
1.7
1.4
15.0
15.2
1.2
1.1
JSW Steel
Neutral
264
-
63,754
64,500
68,245
21.1
21.5
20.1
21.2
13.1
12.4
2.4
2.1
-
-
1.7
1.6
NMDC
Neutral
130
-
41,162
10,209
11,450
47.0
48.0
11.1
12.1
11.7
10.8
1.6
1.5
-
-
3.5
3.2
SAIL
Neutral
79
-
32,690
54,100
63,555
3.0
10.0
(10.0)
1.5
52.8
1.1
1.0
-
-
1.6
1.4
Vedanta
Neutral
336
-
124,786
81,206
87,345
28.0
29.0
26.5
33.5
12.7
10.0
2.9
2.5
-
-
2.3
2.0
Tata Steel
Neutral
693
-
67,262
121,445
126,500
16.2
17.2
65.4
81.3
10.6
8.5
1.7
1.4
-
-
1.1
0.9
Oil & Gas
GAIL
Neutral
463
-
78,375
53,115
52,344
14.2
15.3
30.0
31.1
15.5
14.9
1.9
1.8
-
-
1.2
1.2
ONGC
Neutral
194
-
248,772
83,111
84,934
44.2
44.9
16.4
16.9
11.8
11.5
1.4
1.3
-
-
2.9
2.8
Indian Oil Corp
Neutral
400
-
194,333
396,116
432,560
8.5
8.8
40.1
42.2
10.0
9.5
1.7
1.6
-
-
0.6
0.6
Reliance Industries
Neutral
907
-
589,667
257,711
267,438
17.0
18.2
89.1
89.5
10.2
10.1
0.9
0.9
-
-
1.9
1.9
Pharmaceuticals
Alembic Pharma
Buy
513
600
9,663
3,903
4,584
18.2
19.2
21.8
27.2
23.5
18.9
4.3
3.6
19.8
20.6
2.5
2.1
Alkem Laboratories Ltd
Accumulate
1,941
2,125
23,204
6,320
7,341
17.5
19.8
72.7
96.6
26.7
20.1
4.7
4.0
16.7
18.7
3.6
3.0
Aurobindo Pharma
Accumulate
781
823
45,728
17,086
19,478
22.1
22.0
44.7
51.4
17.5
15.2
3.9
3.1
24.7
22.7
2.8
2.4
Aventis*
Neutral
4,468
-
10,290
2,508
2,862
16.8
16.8
139.9
153.8
31.9
29.1
4.6
3.8
23.5
25.8
3.7
3.1
Cadila Healthcare
Reduce
497
426
50,911
11,584
13,228
20.3
20.4
18.7
21.3
26.6
23.4
5.9
4.9
24.6
22.9
4.2
3.6
Cipla
Sell
608
458
48,953
16,619
19,437
15.4
16.2
19.7
24.3
30.9
25.0
3.5
3.1
12.0
13.2
3.1
2.6
Dr Reddy's
Neutral
2,376
-
39,396
15,844
17,973
17.6
18.2
91.7
111.0
25.9
21.4
2.9
2.7
11.9
13.0
2.7
2.4
GSK Pharma*
Neutral
2,638
-
22,348
3,260
3,651
15.0
18.0
46.1
58.6
57.2
45.0
11.8
12.1
20.0
26.5
6.8
6.1
Indoco Remedies
Sell
260
153
2,396
1,154
1,310
14.9
14.9
11.3
12.7
23.0
20.5
3.3
2.9
15.0
15.0
2.2
1.9
Stock Watch
November 08, 2017
Company Name
Reco
CMP
Target
Mkt Cap
Sales ( Čcr )
OPM(%)
EPS (Č)
PER(x)
P/BV(x)
RoE(%)
EV/Sales(x)
(Č)
Price ( Č)
( Č cr )
FY18E FY19E
FY18E
FY19E
FY18E
FY19E
FY18E
FY19E
FY18E
FY19E
FY18E
FY19E
FY18E
FY19E
Pharmaceuticals
Ipca labs
Neutral
547
-
6,907
3,593
4,022
14.5
15.5
19.4
25.2
28.2
21.7
2.6
2.3
9.5
11.2
2.0
1.8
Lupin
Buy
861
1,467
38,877
18,657
21,289
21.3
23.3
52.8
66.7
16.3
12.9
2.5
2.1
16.3
17.5
2.1
1.7
Natco Pharma
Accumulate
928
1,057
16,174
1,886
2,016
32.3
29.5
23.2
22.0
40.1
42.1
8.4
7.4
20.9
17.6
8.4
7.9
Sun Pharma
Accumulate
528
558
126,644
32,899
36,451
26.9
25.4
31.6
32.3
16.7
16.3
3.0
2.6
18.7
18.8
3.5
3.0
Syngene International
Accumulate
498
556
9,954
1,394
1,818
33.0
36.0
15.8
20.6
31.5
24.2
5.9
4.8
18.6
20.0
7.1
5.4
Power
Tata Power
Neutral
83
-
22,463
32,547
33,806
20.5
20.5
4.7
5.4
17.7
15.5
1.7
1.5
10.5
10.5
1.7
1.6
NTPC
Neutral
178
-
147,099
86,070
101,246
28.3
30.7
12.9
16.2
13.8
11.0
1.4
1.3
10.6
12.4
3.1
2.8
Power Grid
Accumulate
208
223
108,843
29,183
32,946
89.7
90.0
18.0
20.8
11.6
10.0
1.9
1.7
17.7
18.2
7.7
7.1
Real Estate
Prestige Estate
Neutral
288
-
10,793
4,607
5,146
21.0
22.2
7.9
9.8
36.4
29.4
2.2
2.1
10.3
12.0
3.5
3.2
MLIFE
Buy
444
522
2,279
487
590
12.3
17.8
21.0
31.2
21.2
14.2
1.1
1.1
5.2
7.4
3.4
2.8
Telecom
Bharti Airtel
Neutral
514
-
205,606
97,903
105,233
36.0
36.3
9.3
11.1
55.3
46.6
2.7
2.5
5.0
5.6
3.1
2.8
Idea Cellular
Neutral
97
-
35,059
35,012
37,689
27.1
27.7
(4.4)
(2.7)
1.5
1.6
(6.8)
(4.6)
2.3
2.1
zOthers
Abbott India
Neutral
4,535
-
9,638
3,244
3,723
14.9
16.1
167.5
209.4
27.1
21.7
6.0
5.0
23.7
24.8
2.6
2.2
Asian Granito
Buy
483
570
1,453
1,169
1,286
12.5
12.5
16.0
19.7
30.2
24.5
3.2
2.9
10.7
11.6
1.5
1.3
Bajaj Electricals
Neutral
382
-
3,881
4,646
5,301
6.7
7.6
16.1
22.3
23.7
17.1
3.9
3.3
16.4
19.2
0.8
0.7
Banco Products (India)
Neutral
223
-
1,595
1,530
1,695
13.2
12.7
19.0
20.0
11.7
11.2
1.9
1.7
0.2
0.2
1.0
105.9
Coffee Day Enterprises
Neutral
219
-
4,520
3,494
3,913
17.4
18.0
4.8
5.7
-
38.5
1.9
1.9
-
0.1
1.8
1.5
Ltd
Elecon Engineering
Neutral
84
-
942
171
201
15.0
16.2
36.0
43.0
2.3
2.0
0.2
0.2
0.1
0.1
4.9
4.1
Garware Wall Ropes
Neutral
903
-
1,975
928
1,003
15.2
15.2
39.4
43.2
22.9
20.9
3.8
3.2
16.5
15.4
2.0
1.8
Goodyear India*
Neutral
801
-
1,847
1,717
1,866
11.8
12.3
47.9
49.8
16.7
16.1
2.6
2.2
15.6
15.7
0.8
110.3
Hitachi
Neutral
2,450
-
6,660
2,355
2,715
10.3
10.8
49.0
60.9
50.0
40.2
11.7
9.3
0.2
0.2
2.9
2.5
HSIL
Neutral
446
-
3,227
2,240
2,670
14.6
15.0
17.0
22.0
26.3
20.3
2.2
2.1
0.1
0.1
1.7
1.3
Interglobe Aviation
Neutral
1,208
-
43,699
22,570
27,955
14.2
15.0
63.6
81.8
19.0
14.8
10.0
8.4
0.5
0.6
1.6
1.2
Jyothy Laboratories
Neutral
336
-
6,104
1,781
2,044
14.1
15.0
9.4
10.5
35.9
32.0
7.6
7.2
0.2
0.2
3.6
3.1
Linc Pen & Plastics
Neutral
245
-
362
420
462
9.3
9.3
15.3
17.1
16.0
14.3
2.7
2.8
16.9
19.5
0.9
0.8
M M Forgings
Neutral
839
-
1,013
542
642
20.1
21.0
41.6
56.8
20.2
14.8
2.8
2.4
0.1
0.2
2.3
2.0
Mirza International
Neutral
166
-
1,991
1,148
1,285
18.0
18.0
8.0
9.4
20.6
17.7
3.4
2.9
16.3
16.1
1.9
1.7
Navkar Corporation
Buy
190
265
2,716
561
617
41.5
41.5
11.5
12.7
16.5
15.0
1.7
1.6
10.5
10.4
5.5
4.8
Nilkamal
Neutral
1,614
-
2,408
2,317
2,525
11.4
11.1
96.0
105.0
16.8
15.4
2.9
2.5
0.2
0.2
1.0
0.9
Stock Watch
November 08, 2017
Company Name
Reco
CMP
Target Mkt Cap
Sales ( Čcr )
OPM(%)
EPS (Č)
PER(x)
P/BV(x)
RoE(%)
EV/Sales(x)
(Č)
Price ( Č)
( Č cr )
FY18E FY19E FY18E FY19E FY18E FY19E FY18E FY19E FY18E FY19E FY18E FY19E FY18E FY19E
zOthers
Parag Milk Foods
Neutral
257
-
2,161
1,987
2,379
7.6
9.0
12.4
18.3
20.7
14.0
2.9
2.6
8.2
13.2
1.2
1.0
Radico Khaitan
Neutral
205
-
2,723
1,811
1,992
13.2
13.2
8.1
8.8
25.3
23.2
2.6
2.8
10.1
12.0
1.8
1.7
Relaxo Footwears
Neutral
567
-
6,810
1,981
2,310
13.7
14.5
12.0
15.5
47.2
36.6
9.2
7.4
0.2
0.2
3.5
3.0
Siyaram Silk Mills
Accumulate
595
650
2,790
1,769
1,981
12.7
12.7
22.6
26.2
26.3
22.7
4.1
3.5
15.5
15.5
1.8
1.6
Styrolution ABS India* Neutral
950
-
1,671
1,800
1,980
8.0
8.1
42.0
46.2
22.6
20.6
2.5
2.3
0.1
0.1
1.0
1.0
Surya Roshni
Neutral
365
-
1,598
4,870
5,320
7.7
7.8
22.8
28.1
16.0
13.0
2.1
1.8
0.1
0.1
0.5
0.5
TVS Srichakra
Neutral
3,096
-
2,370
2,729
2,893
12.7
12.5
248.5
265.0
12.5
11.7
3.5
2.9
0.3
0.3
0.9
0.8
Visaka Industries
Neutral
667
-
1,059
1,104
1,214
12.1
12.6
31.0
37.9
21.5
17.6
2.6
2.3
0.1
0.1
1.2
1.1
VIP Industries
Neutral
301
-
4,247
1,450
1,693
10.4
10.5
6.5
7.8
45.9
38.5
9.7
8.5
21.1
22.1
2.9
2.5
Navin Fluorine
Neutral
710
-
3,499
945
1,154
22.4
22.6
28.7
34.8
24.8
20.4
4.1
3.5
-
-
3.2
2.5
Source: Company, Angel Research; Note: *December year end; #September year end; &October year end; Price as on November 07, 2017
Market Outlook
November 08, 2017
Research Team Tel: 022 - 39357800
DISCLAIMER
Angel Broking Private Limited (hereinafter referred to as “Angel”) is a registered Member of National Stock Exchange of India
Limited,Bombay Stock Exchange Limited and Metropolitan Stock Exchange Limited. It is also registered as a Depository Participant with
CDSL and Portfolio Manager with SEBI. It also has registration with AMFI as a Mutual Fund Distributor. Angel Broking Private Limited is a
registered entity with SEBI for Research Analyst in terms of SEBI (Research Analyst) Regulations, 2014 vide registration number
INH000000164. Angel or its associates has not been debarred/ suspended by SEBI or any other regulatory authority for accessing
/dealing in securities Market. Angel or its associates/analyst has not received any compensation / managed or
co-managed public offering of securities of the company covered by Analyst during the past twelve months.
This document is solely for the personal information of the recipient, and must not be singularly used as the basis of any investment
decision. Nothing in this document should be construed as investment or financial advice. Each recipient of this document should make
such investigations as they deem necessary to arrive at an independent evaluation of an investment in the securities of the companies
referred to in this document (including the merits and risks involved), and should consult their own advisors to determine the merits and
risks of such an investment.
Reports based on technical and derivative analysis center on studying charts of a stock's price movement, outstanding positions and
trading volume, as opposed to focusing on a company's fundamentals and, as such, may not match with a report on a company's
fundamentals. Investors are advised to refer the Fundamental and Technical Research Reports available on our website to evaluate the
contrary view, if any.
The information in this document has been printed on the basis of publicly available information, internal data and other reliable
sources believed to be true, but we do not represent that it is accurate or complete and it should not be relied on as such, as this
document is for general guidance only. Angel Broking Pvt. Limited or any of its affiliates/ group companies shall not be in any way
responsible for any loss or damage that may arise to any person from any inadvertent error in the information contained in this report.
Angel Broking Pvt. Limited has not independently verified all the information contained within this document. Accordingly, we cannot
testify, nor make any representation or warranty, express or implied, to the accuracy, contents or data contained within this document.
While Angel Broking Pvt. Limited endeavors to update on a reasonable basis the information discussed in this material, there may be
regulatory, compliance, or other reasons that prevent us from doing so.
This document is being supplied to you solely for your information, and its contents, information or data may not be reproduced,
redistributed or passed on, directly or indirectly.
Neither Angel Broking Pvt. Limited, nor its directors, employees or affiliates shall be liable for any loss or damage that may arise from
or in connection with the use of this information.